The introductory undergraduate astronomy classes have labs attached to them, and those labs are run by grad students. The Head TA is a grad student assigned to ensure that those teaching labs have all the information they need. However, in general before you teach a lab, it’s good practice to work through it by yourself. We have a copy of the 110 Lab manual online as a PDF. In addition to just knowing the answers, it helps to know where students tend to make mistakes. In this page we’ve compiled all of the advice we give each other about each lab. If you want to add something, please email the webmaster.
Intro
This lab is a run-through of the math the students will encounter through the semester, like powers, unit conversion, and scientific notation. They don’t like doing this lab, but it becomes a handy reference for them throughout the year. Give an example of how to work a problem in each section, so your students start off right. This lab doesn’t have point values assigned to it, since it is intended only to be a review.
Since this is the first lab, it’s a good idea to take time for some housekeeping: hand out your syllabus, give them the URL for your class website, remind them to buy their lab manual if they haven’t already. You will probably need a few extra copies of this lab for people who don’t yet have their manual. Mention what assignments you expect from them: group labs, individual summaries, campus observatory, observing projects (if assigned). Also mention what you expect from them as far as quality of work (e.g. not showing work, not writing units, crappy summaries). Here’s an example of a good summary and a bad summary, as well as a well-done observatory sheet.
Please talk about plagiarism, especially how even if the information is on Wikipedia (or in the lab manual) it is not okay to copy and use that as a summary. The NMSU Student Code of Conduct has a section on academic misconduct and the NMSU library has a definition of plagiarism. If you suspect plagiarism, keep a copy of the assignment and of the website/book/etc. showing the original work (for your own protection). Talk to the student immediately about the nature of the offense (eg, switching words around does not make the sentence your own work) and the consequences (zero for the question/assignment/class).
If your professor hasn’t already assigned lab groups, you might have to do it yourself.
Scientific notation is trickier for the students than you think, especially when the number is negative, and will bring out some creativity in some students. Since students aren’t familiar with the metric system, they will get confused by table 1.1. Give them a few basics to get a grip on: 1000m = 1km; 100cm = 1m; 10mm = 1cm. Also, decimal format for time may confused them, and they will think 2.33 hr is 2 hr and 33 min.
Students sometimes get hung up on scale length on a map versus the real length that represents. The questions about the map will come back to haunt them in other labs, like Moon, Terrestrial Planets, and Sun. When figuring out which city had a higher average temperature, it helps to point out that they don’t have to actually calculate an average for each city — just looking at their graphs will give them the answer.
For some reason the students really want to cross-multiply when we show them how to do unit conversion, instead of multiplying across the top, the bottom. Watch out for that ‘cos it’s a sneaky trick. It is a good idea to go over unit conversion in the beginning, anyway. If they can do the following, they’ll be set for most of the labs:![]()
Some students will have real calculators, which is great, but they won’t necessarily know how to use them, which is not so great. They don’t understand order of operations and assume that the calculator will know what it is supposed to do. You might need either to explain how to use parentheses on the calculator or just how to plug numbers in properly. Unfortunately, this will haunt you throughout the semester. There isn’t a summary for this lab, but some people like to hand out this. It has questions to get to know the students, as well as a review of what defines plagiarism.
Seasons
In theory this lab will teach students why the Earth experiences seasons. If you’re curious, before you start the lab, poll your students to find out how many believe seasons are caused by the Earth’s distance from the Sun. The setup is involved for this lab, so either Tom or the Head TA will help you set up the lab stations You will need the extension cords, and they should be at the bottom of the first metal shelf in the Bx102 closet. It is important to set up the lamps 1.5m from the globes, or they don’t illuminate the globe properly. For Bx102, this means the lamps are set up at one end of each table and the globe at the opposite end. Unfortunately, there’s an issue of “light pollution”: light from one group’s lamp will shine on the globe of another group, making it harder to see the day/night terminator. Solutions have ranged from making a paper collar for the lamps to group members holding up notebooks to shield their globes.
Exercise #1 has the students measuring out a scale version of the aphelion and perihelion distances to the Sun. They do this with tape on the table. Make sure they measure the distances both side by side, so it is easier to compare them. Watch out when they are measuring the diameter of the Sun in the pictures. Make sure they measure the diameter of the Sun rather than a chord. You might want to remind your students that an ellipse has a major and minor axis.
If you read the lab, you may notice that exercise #2 can be done entirely at home. If you want to save some lab time, ask your students to do it beforehand, if you think they actually will.
In the Elevation Angle/Sunlight Concentration section, the students measure the major and minor axes but actually require the semi-major and semi-minor axes for their calculation. Make sure students don’t confuse diameter and radius! Some people don’t understand that the angle of the light is due to how high the Sun gets in the sky, so this part of the lab may seem stupid to them. Also, some students get confused and think that there’s more energy per unit area in low elevations because the ellipse has a larger area than the circle.
Part of the lab is done with the globes and the light source. Make sure the light is level with and aimed at the globe’s equator and that it is the correct distance from the globe. They have to do many arc length measurements. A suggestion to speed this up is that the students measure the circumference of the globe at the four places marked. Then all they need to do is measure the day side lengths and calculate the dark side measurements, instead of having to measure both. Make sure the students don’t confuse their tables and fill in the wrong one. Oh, yeah, the students may have trouble converting from arc length to length of day. Another suggestion is to split up the class: have the whole class do the first orientation (perpendicular), then half the class do Northern Summer and half do Northern Winter.
If you think the students will take a long time, you can switch it so they do the flashlight-elevation part before doing the globe part. That way they won’t freak during the globe part (which takes a while), thinking they still have a whole other section to do.
Useful websites:
- Cat’s lecture .pdf
- Angle of Sun vs. spread of circle of light
- Answer Sheets: Version 1: .pdf, Version 2: .pdf
- Seasons simulator shows where the Earth gets sunlight throughout the year, click on ‘Show Earth Profile’
- Orbit applet shows the relation between the Earth and the Sun during the year.
- The analemma of the Sun a cool effect of the Earth’s orbit
Surface of the Moon
This is a binder lab meant to familiarize students with the appearance of the Moon, some surface geology, and how astronomers date solar system surfaces. You’ll want to explain about crater impacts and dating and how maria form. For the first questions, the approximate number of craters is fine. The students don’t have to spend half the lab counting all the craters.
This lab is full of scale-distance map questions, which may trip up your students. Remember the intro lab questions about the map? Here’s where it will bite you. When calculating area of a mountain on the moon, make sure they convert image distance to real distance first and then multiply to get area. Watch out with image scale: not every image uses the same scale, but the students will calculate a scale for one image and then try to use it for the rest of the images in the lab.
Regarding the landing sites for the NASA missions, question 6 is the same as question 5. Cat suggests omitting Q6 and making Q5 worth 10 points.
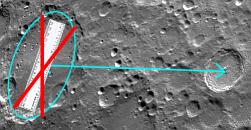
There is a question where they are giving the size of the crater Tycho and told to measure the distance to the crater Clavius in a highliy inclined view of the Moon’s surface. To measure the distance to Clavius properly, they must scale the image by measuring the width of Tycho in the same direction as they will measure distance … meaning, scale the image across the minor axis of the crater. If the image were not inclined at all, this wouldn’t be a problem; but students don’t seem to understand that scaling the image by measuring the major axis of the crater and then measuring a distance along the minor axis is wrong.
 |
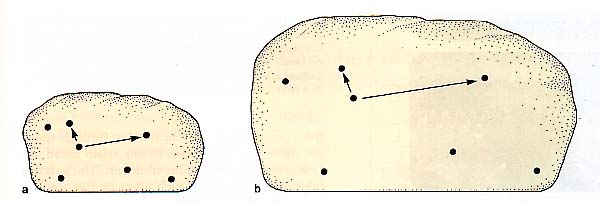
As a rough approximation using Google maps, the Organ mountains are about 200 km2 and NMSU campus is about 6 km2. It’s hard to get a feel for the scale of the images, so Jillian offers the following comparison for the Copernicus crater: size on the face of the Moon, size if it were centered on Las Cruces.
Useful websites:
- Mike’s Moon lecture
- Answer sheets:.pdf
- Moon transit video movie from the EPOXI mission showing the Moon closer to its true color
- Apollo mission movies
- Apollo Expeditions to the Moon amazing detail about the whole program
- NASA Human Spaceflight Programs
Phases of the Moon
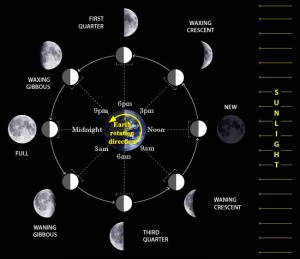
It helps to draw a diagram like the below image. Malynda scanned in the version she uses. As you fill it out, explain why we see what phase we do and why we know the rise-peak-set times. Be careful: your students will start to think that at midnight the moon is always full. Work through the different phases and where the Moon is first; then, once they understand that, go back and explain the times of day. Make sure to mention why we know East is on the left and West is on the right for the diagram; otherwise, if you change the orientation of the diagram they will be lost.
Do lots of examples like exercises 4, 5, 6, and most of your students should get it.
Cat likes to point out that changes in phase go from right to left (in the Northern hemisphere): as phases progress, light comes in on the right and moves across the disk until it’s full, then darkness comes in on the right and moves across the disk until it’s new. She notes that this is because astronomy is backward (true, true).
Useful websites:
- Cat’s lecture: .ppt
- UNL java applet demonstrating phases of the Moon
- Lunar libration animations: without phases, with phases
Comets & Impacts
This is the fun lab. Don’t wear black.
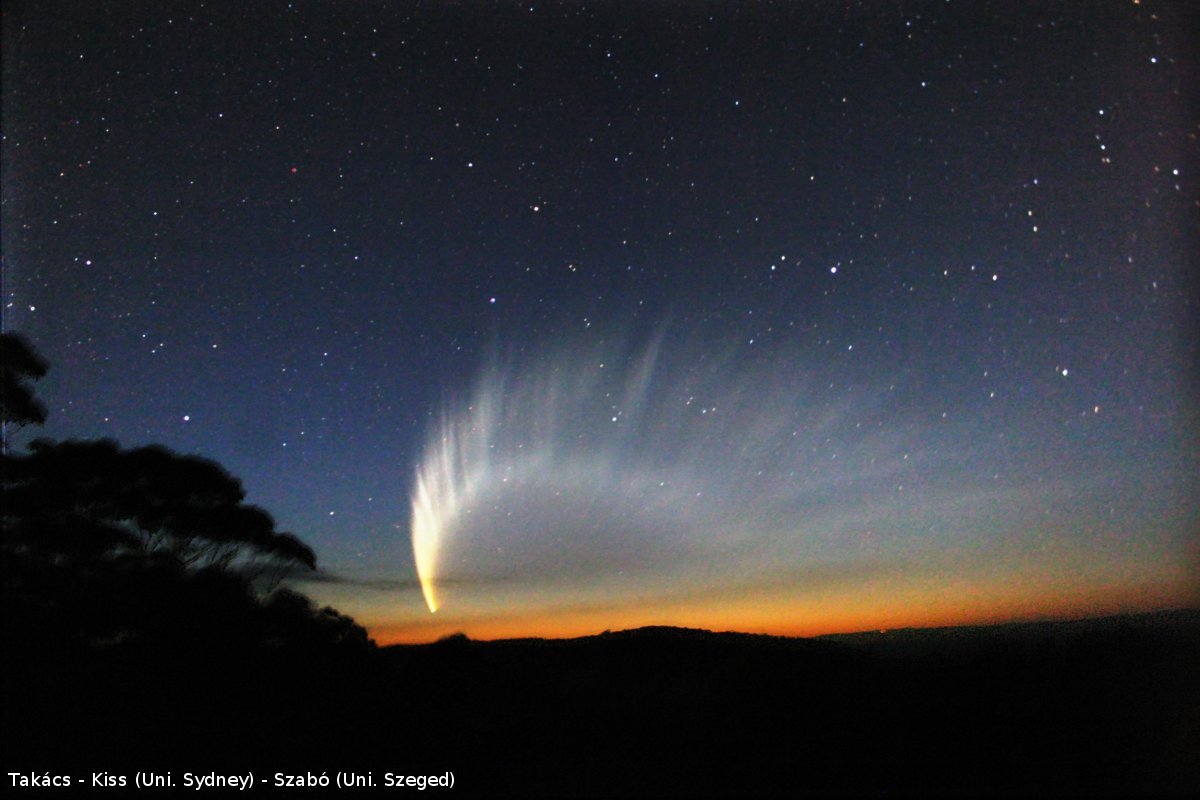
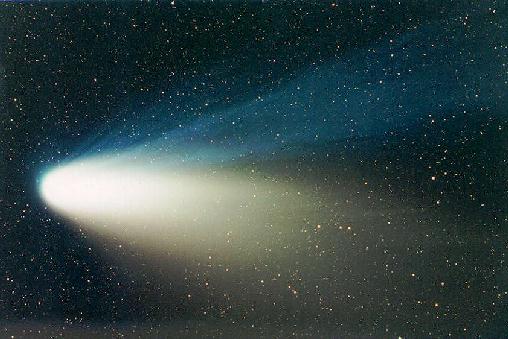
This lab is to familiarize students with the small (leftover) bodies in the solar system. You may want to show them the department’s meteorites (which are huge); they’re kept in a metal toolbox in Ofelia’s office. It’s nice to show some pictures of comets, to explain the orbits and morphology, and of asteroids, for comparison. Make sure they understand about the different populations of objects, relating to solar system formation. Otherwise, they walk away thinking that asteroids are dead comets (e.g. when comets run out of ice and gas, their orbits shift and circularize them to the asteroid belt). Emphasize that tails form only when the comet is near the Sun and why. You can link the importance of understanding comets to the beginning of life on Earth, as handy delivery packets of water and seeds of life (amino acids on Comet Wild 2, amino acids on asteroid 2008 TC3, amino acids on Murchison meteorite).
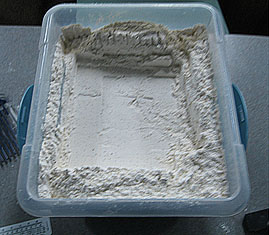
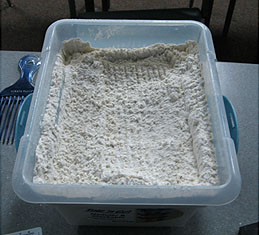
While they wait to make a comet, the students will drop ball bearings into flour to simulate cratering on the Moon. They’re supposed to measure the size of the crater produced by a small and large ball from various heights. Measuring the crater size can be tricky, as is setting up the flour for the best impact. This is as messy as it looks. If you lay down paper around the flour bins, you can catch most of the flour by folding them up and throwing them away. You can also try taping sheets together to make a cylinder, which you can put on top the flour to prevent the ejecta from escaping the bin.
 |
 |
|
| Pack the flour down as much as you can with the wooden block, but leave a little unpacked flour on the edges. | Carefully rake the extra flour over the heavily packed flour. | Gently smooth the raked flour with the wooden block, since the rake marks make it tough to pick out the crater. |
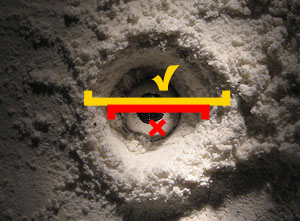
| Your students might have better estimating the size of the crater by illuminating it from the side with a flashlight. This might help them see the size of the crater versus just seeing the size of the hole the ball bearing bored into the flour. | |
 |
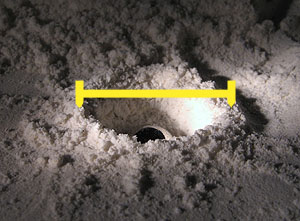 |
| Measure the width of the crater using the debris around it rather than the cylinder bored into the flour by the ball bearing. | Try to measure the diameter using the highest point of the crater rim. |
 |
|
| The students should find a positive correlation between impact velocity and crater diameter. They should also find that larger ball bearings make larger craters. Thanks to Liz for the graphs. | |
To simulate the effects of solar irradiation on the comets, you can either grab the overhead projector from Ay119 or use a desk lamp (from the Seasons lab setup) and a hair dryer (the hair dryer is in the closet, in the cabinet labeld ‘comet lab’). You put the comet on the projector/shine the desk lamp on it and use a hair dryer to simulate the solar wind. You do get some nice illumination of outgassing. This may leave a bit of a mess on the projector or the table, so please remember to clean up when you are done.
Section 4.3 has a question about dropping your comet and a rock on the ground and noting what happened to each one. This question is printed at the beginning of the lab, but the students don’t drop the objects until the end. People often forget it’s there, so remind them to answer it and get full credit.
Useful websites:
- Mike’s Comet Lab lecture
- Cat’s lecture:.pdf
- Answer Sheets:.pdf
- Impact Earth simulate the effects of different impactors
- Dramatic brightening of Comet Holmes (17P) and Wolfram Research has a neat Comet Holmes Demo (requires free Mathamatica Player)
- JPL’s Shoemaker-Levy Collision with Jupiter
- NASA’s Deep Impact mission
- NASA’s Stardust mission
- Comet videos: detection over time animation, asteroid Vesta rotating
- Comet pictures: West, McNaught, Hale-Bopp, Wild2 nucleus, Haley’s nucleus
- Comets in ancient cultures
Terrestrial Planets
This is a binder lab where the students look at a lot of pictures and compare planet surfaces. They should get an idea of what can change the surface of a planet: cratering, geologic activity (volcanic or techtonic), and erosion/weathering. There is no math in this lab, so you will have happy students!
You will need to explain the difference between shield and composite volcano types. It’s helpful to remind the students of the possible resurfacing agents: erosion (wind and water), tectonic activity (recycling continents), and volcanic activity (lava flows).
Students are given topographic maps and asked to comment on which planet has the most relief. You may have to explain that ‘relief’ refers to texture of the surface, that a low relief surface is smooth and a high relief surface is rough/ragged/structured.
Students are asked to comment on water-carved features. They get confused with the different colors shown, where water is a muddy brown and land is a dark blue. Also, in one picture there are clouds with dark shadows, and students sometimes think these are islands.
Question 20 asks about teardrop shapes around craters and how that might indicate the presence of water; they won’t get it. Help them visualize how water would flow around the crater, creating an eddy downstream where more sediment would be deposited, resulting in a teardrop shaped mound.
Useful websites:
- Mike’s Terrestrial Planet lecture
- Cat’s lecture: .pdf
- Answer sheets: .pdf
- “Space voyaging rock reveals insight into detecting life on other planets“
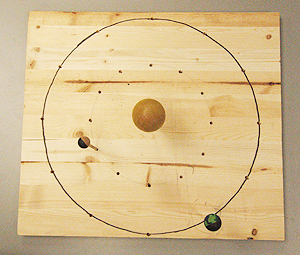
Kepler
This lab helps the students visualize Kepler’s laws of planetary motion using a computer program. The CDs with the Kepler software are stored in the server room (Rm 118), typically on the shelf with the other DVDs and tapes. Groups larger than 3 students are not good for this lab, since that leads to one or two people doing the work while the rest sit around getting bored.
Since this is a computer-based lab, you will have to use one of the computer labs on campus, and we typtically use Jacobs 129. Reserve the computer room way in advance of your lab using the ICT lab reservation request form, and make sure either you or the Head TA checks to ensure the software still works on the computers (sometimes we have issues when ICT does software updates). If you have a Windows laptop and want to play around with the software, you may need to put the threed32.ocx file in your C:Windowssystem folder. If the program doesn’t work at all, you can try using java applets as backups:
- First, Second, and Third laws Applet allows you to adjust the semi-major axis, the eccentricity, and the animation speed. Click each tab to demonstrate each law (sum of distances to foci, equal area in equal time, and period versus semi-major axis).
- First law Applet allows you to pick the starting point and initial velocity of a planet orbiting our Sun
First law Applet allows you to change the orbit size and eccentricity of a planet orbiting our Sun. - Second law “Continue” and “Pause” start and stop the simulation. Clicking “Start Sweeping” and then “Stop Sweeping” will show the area covered in a certain time, and then clicking “Start Sweeping” again at some other point in the orbit will show the area covered in that same time interval.
Second law A simpler demo that shows areas at perihelion and aphelion - Third law Applet demonstrates how eccentricity doesn’t affect the period by showing two planets with the same semi-major axis but different eccentricities.
- First law Applet allows you to pick the starting point and initial velocity of a planet orbiting our Sun
- Simple binay star orbit Applet allows you to adjust mass ratio, inclination, and eccentricity
- Chaotic planet orbits in a binary star system
Various setups for Earth-Moon-Satellite 3body systems
You should go over the laws (and the law of gravity) in your intro lecture. This is a long lab to do and to grade. Stay on top of your students so they finish on time; if they goof off they’ll end up needing an extra half hour. Groups of five or larger are unwieldy for this lab, so have your students break into smaller groups if you need to.Explain exercises 1 and 2 but suggest doing them last. They can do them at home if they run out of time. Be warned, the students don’t visualize the sum of the distance to the foci staying constant, even with the imagery of the colored arrows. They’ll say something like ‘the blue arrows get shorter and then longer’ to describe what happens.
The instantaneous velocity equation, V=SQRT( (G(M+M) / (2/r – 1/a) ), really confuses the students. Remind them that they will set a and G(M+M) equal to 1 and then solve for V when r=0.5a for perihelion and when r=1.5a at aphelion. Some students just don’t know how to do this, but other students get it creatively wrong: they set a and G(M+M) equal to one, but then they stick in r=0.5a and don’t know what to do with a.
In the past, some machines only accepted mass-ratio values less than one, whereas others accepted anything. For the problem with m1=4 and m2=1, q=0.25 was a safe bet, as opposed to q=4. For finding the value of q “at which larger values cause the planet to ‘stay home,'” Give them a range to search in and suggest an increment to step through it, otherwise they have no clue where to start.
Alternately, you can use the non-computer Kepler’s Laws lab that Jillian wrote. You will need some supplies for the lab, though: string, tape, thumbtacks, and 8.5×11″ pieces of cardboard. Students completed this lab in 1.5 – 1.75 hours.
Useful websites:
- Mike’s Kepler’s Laws lecture
- Answer Sheets: .pdf
- Kepler’s laws almost the same as the program we use
Orbit of Mercury
Please go through this lab entirely before you teach it; you do not want to do this on the fly. This lab has students draw a fairly accurate representation of Mercury’s orbit using only a humble protractor. Why do we bother?
- It’s awesome that they can get so close to the actual orbital parameters using only a protractor
- We can show students how we know orbital shapes even when we can’t pan out of the solar system and see orbit tracks laid out in space
- We can also show students that astronomy is tough but do-able
- We’re evil (students usually only believe this one)
Demonstrate how to graph Mercury’s position either by using the document projector or by showing them Nikki’s awesome pre-lab lecture (9.3MB PPT also works moderately well in OpenOffice). Do this for a few positions, so they get the hang of it. Cat created an excellent cheat sheet for drawing the orbit. There is a copy of a blank orbit and extra copies of Cat’s cheat sheet in the Master Copy Binder in the Bx102 closet. Make extra copies if you need it. In fact, bring a few extra copies with you, just in case; you can always donate ’em to the next person to do the lab.
It helps the students if everyone draws their own orbit, rather than one person drawing it per group. No one is sitting around bored and they can pick the best orbit for their lab calculations. Students can confuse Earth and Mercury angles, and they get confused about flipping the protractor
for Eastern and Western elongations. It might help your students if they go through and draw all of their Earth positions first (and label each one with the elongation number), then draw all of the Eastern elongations, and then draw all of the Western elongations. Check each group’s first few Earth points to make sure they’re doing it correctly. One wrong point will send them into crazy orbit land.
Students don’t always make the connection between an elongation angle and the top-down view of the orbital setup. Candace created a wooden model which might help them grasp this. Students can put Mercury at various points in its orbit and see how far it would appear from the Sun from Earths’ point of view (example).
Also, the students won’t have had much practice using protractors. Explain that angles are measured with the vertex in the little circle of the protractor. Emphasize that the angle they will be measuring is from the normal (whatever number of degrees from 90o), rather than going by the number written on the protractor (e.g. measuring 30o to the left means making a mark at 60o rather than 30o).
Some students don’t understand why we convert from measuring the semi-major axis in millimeters to AU. They will continue to use their measurement in millimeters for the calculations, and consequently get really weird numbers.
Make sure you write on the board the accepted values for the orbit of Mercury:
| Period | 87.969 days | |
| Semi-Major Axis | 0.387 AU | |
| Eccentricity | 0.2056 |
Useful websites:
- Cat’s lecture: .pdf
- Helpful Handout
- Venus’s phases (also works for Mercury)
- Answer sheets: .pdf
- Venus orbit and apparent size and phase (also works for Mercury)
- Inferior planetary phases for the Copernican and Ptolemeic systems
Scale Model of the Solar System
To save some confusion, have your students do all of the calculations in beginning. When everyone is done, they can lay out the solar system. It helps keeps students sane if you point out the “entry” button (2nd – enter on most TI calculators) on their calculators, which makes the repetitive calculations much easier and cuts down on errors. Mike created a nice explanation of conversion calculations in PDF and HTML formats. If students ask why Neptune and Pluto don’t collide, one of the reasons is because of Pluto’s orbital inclination. When Pluto is at its closest to the Sun, it would be around 22 yards above the football field. At its farthest point, it’d also be around 26 yards underground. The other planets are roughly coplanar, and don’t travel more than 1 yard above/below the field. See here for more details.
Fun facts:
- On the same scale, Proxima Centauri is about 386 miles away…or 30 miles north of Taos. The Great Andromeda galaxy is ~2.5 AU away.
- Proxima is also about as far away as Phoenix. Alpha Cen A is a little bigger than the Sun and Alpha Cen B is a little smaller. If the Sun is a nickel, then Alpha Cen could be thought of as a quarter, a penny, and a (something slightly larger than Jupiter).
- At this scale, the speed of light is about 1 inch every 5.5 seconds. To imagine sending communications from Earth to a spacecraft, you might picture it as being sent by “messenger ant”. If you had a spacecraft at Pluto, it would take over 5 hours for your message to reach it, plus that same time for its response to get back to you – be it “okay, I’ll do that” or “what?”.
Useful websites:
- Mike’s Scale Solar System lecture
- Helpful cheat sheet to hand out
- Fun facts about the planets
- Washington DC National Mall scale solar system
- Eugene, Oregon scale solar system
- Build your own solar system
Density
Make sure your students double check the mass of the golf ball. If they use a 20g ball and think they’re using 10g, they will end up with golf balls which should float on water. Also, they need to measure the mass of their lava before measuring volume. If they do it the other way around, the lava will soak up water and mess up their mass measurements.
Useful websites:
- Mike’s Density lecture
- Cat’s Lecture: .pdf
- Density of bulk materials including apples, butter, cocoa beans
Take shadow measurements a few days before lab at the same time as you’ll be doing them in lab so you know what numbers they should be getting and can make up Boulder numbers if necessary.
A good website for calculating the sun’s elevation angles is http://aa.usno.navy.mil/data/docs/AltAz.php. This site gives elevation angle, which is 90 minus the angle the lab requires. The students measure the LC shadow, and you’ll have to tell them the Boulder shadow length (which you can calculate from the angles from that website). I use meter sticks and chalk for this. When calculating circumference from their shadow lengths, make sure everyone’s calculators are in DEGREE mode and make sure everyone understands the difference between TAN and ATAN. The earlier labs should get an Earth circumference of ~41,000km. The later labs will probably get an answer in the 50,000’s.
To calculate acceleration due to Earth’s gravity, there are stop watches, water balloons, and tennis (or other) balls in BX. If you use water balloons, please clean up afterward. Most students get 10-12 m/s^2 for acceleration (fall times of ~1.2s). Make sure you get the penthouse key AND the roof key from Ofelia ahead of time (she takes lunch break from noon to 1p). The penthouse is currently Reta Beebe’s office. Email her ahead of time and let her know you’ll be accessing the roof from her office. (She is very friendly, and she thinks this lab is great, so she probably won’t give you any trouble.)
The whole point of the lab is to fill out Table 3. These are the rough answers (orders of magnitude):
Mass, 1024 kg
Volume, 1021 m3
Density, 103 kg/m3 or 5-8 gm/cm3
Even if students are terrible at measuring shadows and timing falling objects, they usually get the right orders of magnitude for this table. CHECK THEIR ANSWERS — if they’re wrong, it usually means they typed something into their calculators wrong. This is the usually the first lab where they have to deal with scientific notation on a calculator, and some (or most) students don’t know how to type it in (or they use ‘e’ instead of ‘E’).
Questions 2 and 3 of the in-lab are essentially the same. Explain Q2 on the board — write the equation for circumference and then walk through how the circumference changes (does it increase/decrease) if the LC angle increases. After you establish that C increases, ask them what happens to R (increases). Write the equation for density (in terms of R — the mass equation is given in the lab). Mass has an R^2 dependency, and volume goes as R^3. Ask them what this simplifies to (density ~ 1/R). Since we already established that R increases, ask them what happens to density (decreases).
For the take home, 1-1.5 pages is usually sufficient (check with the other TAs so everyone requires the same length). For potential errors — the Eratosthenes method is most accurate if the shadows are measured at local noon on the summer solstice at 23.5 lat so that one city has no shadow. Since that’s not available to us, doing it at local noon (which is around 1.30p if you’re in DST) is the best you can do. This was one of the intended answers for the questions about potential errors. However, that’s beyond most students’ capabilities. More common answers include not holding the meter stick straight, marking the shadow wrong, clouds interfering with shadow measurements, human reflex times affecting the stopwatch measurements.
- Cat’s Lecture: .pdf
- Helpful Cheat Sheet (link borken)
Useful websites:
- Cat’s Lecture: .ppt
- Helpful Cheat Sheet
No suggestions are available for this lab — please provide some!
Since students tend to make the same mistakes, Jim created two useful documents for this lab, one with help with the take home part and one with full explanations for common mistakes. The common mistakes one is useful for grading, so you can make copies and staple it to the labs rather than writing out the same answer over and over.
Don’t confuse dendritic and anastomosing: the former means ‘having a branched form resembling a tree’ (like leaf veins) and the latter ‘cross-connecting between adjacent channels, tubes, or fibers’ (like an intertwined rope). Also, make sure the students know which is Warrego and Ares Valles. If they confuse the two, their answers will be wrong.
Explain how normal people use transparencies and the thin sheets of paper that go underneath when they’re done. When measuring length and width, make sure they use the images, not the pattern they traced on the transparency. They will forget to multiply by 100 to get water volume from dirt volume.
- Mike’s Water on Mars lecture
- Mars’ apparent size if they ask about Mars being as large as the Moon at closest approach
This lab is painful for the students. Write on the board a step-by-step process so they don’t get lost. Also, make sure your lecture includes an explanation of Wein’s law and blackbody radiation, regardless of whether or not their professor has talked about it in class. Explain what’s going on with the IR and visible cameras: the IR camera had much worse resolution, so the pixels were huge compared to the visible camera. A large chuck of the text that explains how to fill out the table is wrong. Completely wrong. Most students don’t read it, but some do and more chaos ensues.
Students can get confused with the same quantity having difference values with different units. Suggest to your students that they convert to degrees Fahrenheit last, so they don’t use the wrong temperature value to get the other temperature values.
Useful websites:
- Mike’s Io Heat Loss lecture
- Cat’s Lecture: .pdf
- Carina nebula in visible and IR
- A person in visible and IR
- Visible and IR of Spitzer satellite on its Delta-II rocket, and the gantry
No suggestions are available for this lab — please provide some!
This lab is new to rotation and is still being ironed out. It will be introduced to the lab manual in the Fall of 2015. It is written by Ethan Dederick, so if you find inconsistancies or have suggestions, please let him know. If you do this lab, please send in your comments! What follows are suggestions from Ethan.
This lab is a little different from some of the other labs, because you get to walk the students through the lab as an entire class rather than releasing them to do tasks in their groups. The calculations will be done in their individual groups, but the class collaborates quite a bit. The tricky part of this lab is having the students actually do the calculations. There will be some math that some of them may not have seen before. For example, they have to use a log when calculating a magnitude. This isn’t a math lesson, just do one example and show them where the log button is on their calculator.
The lab is computationally intensive to begin with, but I recommend moving through that as quickly as possible so that much time remains for discussion about the flyby and lander images.
REMEMBER: This lab is also different in that the class can go several different directions. There is no right or wrong system/planet to investigate so the students do have freedom to investigate the planets they would like to.
As far as the orbital images go, do not show the students the Climatemap image as those were not generated correctly; do not show them the Noisemap unless they are interested in noise in data; the Mergemap is the actual map of the surface; Nightmap is the surface at night; the Heightmap is the elevation of the surface (NOTE: white is higher elevation, black is lower); do not show them the Embossmap unless you would like to-it only reveals surface detail a bit sharper but at the expense of the color of the image.
Parallax
Go through this lab on your own beforehand. You do not want to try teaching this blind This lab explains the only direct distance-measuring technique we have, which should be impressive; however, no matter what you do this lab involves a lot of math, which students usually don’t like. We normally project a ‘ruler’ on the front screen, measure the parallax of a stick with respect to the tick marks on the ruler, then convert the parallax angle to degrees and calculate a distance. The equipment for this lab should be set up at the back of the room. Two groups should be able to go at once and complete 8.1.1-8.1.2. While the other groups wait, they can answer questions in 8.1.3 – 8.2.
There should be a PDF file on the desktop of the computer labeled ‘parallax ruler’; if not, here is a copy. Open it in Acrobat and be sure to display it in full screen mode. You may also use the long paper ruler Nicole uses for her version of the parallax lab. It should be in the closet, but there is also a copy in the Master Copy binder.
There is a long piece of tape at the back of the room and three positions marked with Xs in the aisles between the tables. The students sit on chairs with their heads over the long piece of tape to do their parallax measurements. The object whose parallax they are studying is a coffee stirrer attached to a wooden base. When moving it to different distances, ensure that the coffee stirrer itself is right over the tape mark for that distance (as opposed to the front of the base being on the tape mark). The students should get within a meter or half a meter of the actual distances (except the third distance might be worse than that) but there will still be error in the student who does the measuring, as they move their heads slightly. Two protractors will be set up to measure the angular span of the tick mark ruler. The idea is that a student sits and sees how many degrees constitutes our 20 tick mark ruler, allowing them to convert their parallax angles from tick marks to degrees. They only use one eye for this measurement and make sure their head is over the long piece of tape in the back and the protractor is right up against the bridge of their nose. They will also need to measure the distance to each tape mark, and they can do this while the rest of the group measures parallax angles or angular span of the tick mark ruler.
To beat down your students’ errors it helps to have two people be “observers”, who hold their heads very still, blink their eyes, and measure the coffee stirrer’s parallax angle at the different distances. For each distance just average the parallax angle they report. Also average their baselines (distance between each pupil’s pupils). Just have one person measure the angular span of the tick mark ruler.
There are three parallax equations in the lab: tangent version, small-angle approximation version, and parsec version. Invariably, the students confuse them and end up not using the parsec version when calculating distances for stars. Make sure they understand what each equation requires in terms of units, what it spits out, and when to use them.
Jeff makes a recommendation to speed up the lab by making the actual parallax measurements a full-class activity. Break your lab into three groups. Have the parallax protractors set up at the back of the room. For your object use the green pointer stick (which might be next to the computer or bundled with the meter sticks) secured in one of the metal bases. Have 1/3 of the class do the parallax measurement for each distance (near, middle, far). Average the resulting measurements for each distance and have the whole class use these numbers. Pick a few students to measure the angle for the whole scale to get the ticks-to-degrees converstion factor and have the whole class use that.
The last question involves determining the distance to a star using two “pictures” taken 6 months apart. Teresa suggests explaining this to your students in 4 steps:
- Find the scale
- Measure how much star P shifts on the picture
- Convert that shift to arcseconds using the scale you found in Step 1
- Divide α by 2 to get θ and solve the parallax equation, d = 1/θ
Useful websites:
- Mike’s Parallax lecture
- Lauren’s Parallax Lecture: PDF
- Answer sheets: Version 1: .pdf, Version 2: .pdf
- Parallax applet, another parallax applet
- ESA’s Hipparcos mission
Optics
A lab involving lasers to teach students how light behaves with mirrors and lenses? Whoop-whoop! Each lab group should have an “optics bench” setup (bench with lenses and light; protractor and flat mirror with carpenter’s laser level), and Tom or the Head TA will help with setup. At the front of the room you will have the three-lasers-on-a-stick, the curved mirrors, and smoke machine. Since the lens light and laser light may be faint, you might want to turn most of the lights off. The fog machine takes a few minutes to warm up. If it is turned on before you begin your pre-lab lecture it will be warmed up in time for lab.
The equipment at the front of the room is meant to demo the behavior of curved mirrors. You can either do the demo once for the whole class at the beginning of lab, or do the demo as each group comes across that section of the lab. Use the smoke machine and lasers-on-a-stick to illustrate different light paths and demonstrate focal length. Tom made a rough curved mirror by attaching a series of flat mirrors to a curved piece of wood. This should help students transition from understanding how flat mirrors work and treating curved mirrors like finely faceted flat mirrors. Students are supposed to draw the light paths on a sheet at the end of the lab.
Students start out investigating a flat mirror with the laser level and are supposed to figure out that, when measured from normal, the angle of incidence equals the angle of reflection. Make sure they measure the number of degrees from perpendicular (90o) instead of just reading off the number on the protractor; otherwise, you’ll get them saying that the angle of incidence was 70o and reflection 110o.
Students then investigate how lenses focus light. In the lab the lenses are referred to as “positive” (convex, magnifies image) and “negative” (concave, demagnifies image). Watch out, your students might amuse themselves by short circuiting the transformer, that is by clipping the black alligator leads to each other. This will eventually destroy the transformer. Please check at the end of the lab to make sure no one’s connected the leads together. Also, the alligator clips are soldered to the wires, but the connection isn’t strong enough to take a lot of metal fatigue. Remind the students not to play with them and the transformers will last a lot longer.
This lab is cool because after playing around with the individual lenses, the students get to build two telescopes, Galileo’s and Kepler’s. It’s like the telescope shown in picture below except without the brass cylinder body, Johnny Depp, or Orlando Bloom.
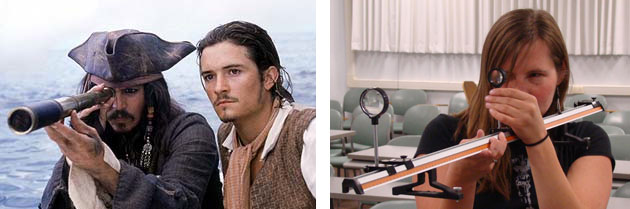
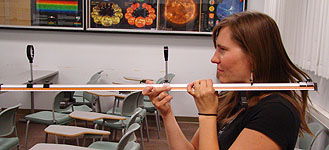
When students are building their telescopes, they might try to look through the telescope backwards. Remind them that the smaller lens is referred to as the eyepiece in the lab, so it should go next to their eyes, while the large lens is the primary that is imaged by the eyepiece and should be at the far end of the telescope.
Also, while the Galileo telescope works just fine the Kepler telescope seems to focus best when your eye is a little distance from the eyepiece rather than being smack up against it, as shown to the right.
It’s easy to calculate the magnification of Kepler’s telescope, since the students already calculated the focal length of both lenses. Galileo’s is trickier because one of the lenses is “negative” and has a negative focal length. To calculate the focal length of the “negative” lens, remind students of Figure 9.3 and the two paragraphs beneath it, which step them through the calculation.
The students may confuse the behavior of curved lenses and curved mirrors, but hopefully they’ll figure out that lenses refract while mirrors reflect and that concave mirrors focus but concave lenses defocus. Students may get confused between the shapes, but you can remind them that “concave” is like a “cave for the light”.
Bobby has an interesting way of explaining why the light refracts as from changing media, a physical model which gives them an intuitive feel for refraction. Imagine a car driving on a regular road. Imagine a sandy road crossing the regular road at an angle (not perpendicular). When the car reaches the sandy cross-road, the tire that hits the sand first will slow down, and the car will swerve in that direction.
Useful websites:
- Mike’s Optics Lab lecture
- Answer sheets: Version 1: .pdf, Version 2: .pdf.
- Behavior of lenses and mirrors
- Refraction of a straw
- Refraction by different materials
Spectroscopy
This is a quick lab to do but a lot of ideas for the students to digest. Students get to look at spectra from different elements and from blackbodies of different temperatures, which should give them an idea of how we can know an object’s temperature and composition just from the light it emits. Some of the guys may be color blind. That doesn’t mean they can’t do the lab; in fact, this is the one lab where it won’t matter. You might want to turn out the lights for this lab.
In class your teacher might not have covered the Bohr model of the atom and the idea of quantization; if this is the case, you will have to explain it. Good luck. Since students get confused about emission, absorption, blackbodies, and the different ways we display spectra, Jillian created a reference sheet to give to your students. There are extra copies in the Master Copy Binder, so please give them to your students. If you explain about the Doppler effect and radial velocity determinations, make sure they don’t mistakenly think that all red stars are receding and all blue stars are approaching.
Typically you will have several ‘spark tubes’ set up around the room. These are black boxes — ha ha ha. No, really: the power supplies are 1′ tall black boxes that plug into the wall and send current through glass gas tubes. Well, except for two setups that look like they are from Dr. Frankenstein’s lab with bare metal prongs to grasp either end of the gas tube. What elements do you show? A few suggestions are hydrogen, helium, neon, and mercury. You will need to set up one ‘mystery element’ with the table-top spectrographs pointed at it, and we suggest you use hydrogen. The idea is that the students measure the wavelength of the lines they see and determine which element it is by comparing their lines to a table in the lab. The gas tubes are in the Bx closet, in the back in the farthest metal cabinet, usually on the top shelf in three large plastic boxes. Warning: some tubes might be mislabeled! We go through and add labels to each tube, but they come off after a while, or fall off and are mistakenly attached to the wrong tubes.
You will also need to set up a blackbody source, which is just a tungsten bulb attached to a variable power supply (with an awesome retro dial on it!). Students have had trouble seeing how the continuum source varies with temperature: they might see that it gets dimmer as it gets cooler, but you will have to point out to them that they only see the blue/purple light (or see it the strongest) when the most current is running through the bulb.
Section 10.6 refers to a web applet which shows blackbody curves for different temperatures. You can either use the projector and go through this section as a class or have individual groups go up and use the computer during lab. Students are asked for peak wavelengths for different temperature blackbodies. The applet doesn’t list peak wavelength explicitly, so they have to figure it out from the graph. You could alternately use another applet which does list the peak wavelength (when you click on the graph). Students don’t get question 10.6.6, so you might end up having to point out the inverse relationship between temperature and peak wavelength and pointing out that room temperature is around 300 K (makes the math easier, anyway).
The hand-held spectrographs are not the most precise instruments in the world, so they are just to give the students an idea of how spectra appear and vary. The hand-held spectrographs cost $30 each to replace, so warn your students that they are not toys. If any spectrographs don’t work, put them aside and let either Tom or the Head TA know. The table-top spectrographs are more accurate, however you need to shine a flashlight on the white reflector tabs to illuminate the scale in the eyepiece.
Students can get confused about light and energy and think that photons have a temperature, making gamma ray photons hotter than radio photons. If they don’t understand that light travels at a constant speed in a vacuum, they will also think that gamma rays travel faster than radio waves.
Useful websites:
- Mike’s Spectroscopy Lab lecture
- Answer sheets: Version 1: .pdf, Version 2: .pdf
- Blackbody applet
- Exciting an electron in a Bohr atom
- Spectral lines of neutral atoms, and David’s Whizzy version
- Kirchoff’s Laws applet
Reflectance Spectroscopy
No suggestions are available for this lab — please provide some!
Useful websites:
The Sun
This is mostly a binder lab. Make sure you have answers on hand, for students find the most interesting ways to make mistakes. There is no way to avoid it: students get confused when subtracting times. Just … be patient. As you know and love from the intro lab, there are image scale questions in this lab. Some of your students will still be confused by the fact that the image scale changes for each image. Keep reminding them that they need to use the size of the Sun to figure out the scale of each image (they conveniently contains either the whole Sun or half of the Sun). A backup of the images is kept here.
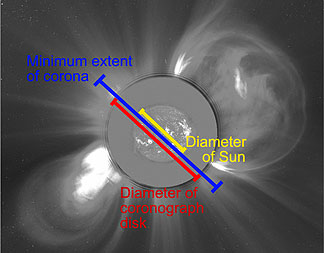
Please explain how images of the Sun are taken with a coronograph. We’ve noticed that when asked to measure the extent of the corona students measure the black disk of the coronograph instead of the light around the Sun.
If your lab is during the day, you can use the solar telescopes to show the students the Sun. These telescopes filter out some 99.9% of the light and have an H-alpha filter. To point the telescope at the Sun, it’s easiest to look at the shadow of the frame. The frame is longer than it is thick, so when you minimize the size of the shadow it must be pointed close to the Sun. A small white dot will appear on the circular finder scope, which you can center to get the Sun in the eyepiece. You can tune the wavelength a little around H-alpha by turning the barrel clockwise and counter-clockwise. The focus is changed using the silver knob underneath the eyepiece. Check SpaceWeather to see if the Sun has any sunspots the day of your lab.
If your lab is at night, or it’s cloudy, you can use the electromagnet to demonstrate the shape of a dipole magnetic field. Students can experiment by pouring iron filing in the white trays and placing a magnet under the tray. If they put it in the tray, they have to clean the damned filings off it themselves.
The Sun rotates every 25 days at the equator and takes progressively longer to rotate at higher latitudes:
25 days @ equator
27 days @ 35o
33 days @ 75o
35 days @ 90o
Useful websites:
- Mike’s Sun Lab lecture
- Cat’s lecture: .ppt
- Answer sheets: Version 1: .pdf, Version 2: .pdf.
- SpaceWeather
- SOHO satellite has excellent movies of the Sun and also where we got the MDI intensitygram images
- The solar spectrum in visible
- Integrated Space Weather Analysis System (ISWA). Select events to show effect of flares on the solar system
HR Diagram
In theory this lab teaches students about stellar evolution and familiarizes them with the different sections of the HR diagram. Your lecture should cover the basics of how stars change over their lifetime and the different sections of the HR diagram. Emphasize that the diagram is just a plot of temperature and brightness, and that in practice we use the proxies of color and magnitude. Oh, and that we really like star clusters because the stars all formed at roughly the same time and are at rougly the same distance (nixing that pesky reddening/distance problem). If you are printing the HR diagram lab, please print from the PS file and not from the web page. The images are scaled differently on the web and it will screw up your numbers. Have the students use the first line of the table to learn to use the dynameter properly, calibrate how far in the star has to be to be properly measured. Please ensure the students use Eqn. #2 to calculate the (B-V) color, rather than just subtracting the numbers. Watch out, they might get confused and try to put the equation number in the equation. When the students graph their points, make sure they label each point; that way they can go back and remeasure the correct star.
It helps to force every student to make their own HR diagram, especially if they have to hand it in with their summary. That way no one sits around bored while one person in the group does all the graphing, and in theory they might understand it better if they do it themselves. If you want to save time, you can use these pre-made HR Diagram graphs, which have the 53 given points plotted:
student version (PDF) (0 of the 63 points)
TA version (PDF) (all 63 points)
There is a copy of the TA graph, as well as extra copies of the pre-made student graph and the B and V filter images, in the Master Copy Binder.If you are using the two week long version of the HR diagram lab, you will use this version of the lab. Additional help can be found here.
Useful websites:
- Mike’s HR Diagram Lab lecture
- Answer sheets: .pdf, 2 week version
- HR diagram simulator does not include HB, RGB, AGB
- More complicated simulator shows path of star on diagram for different masses
- More complicated simulator animation shows path and size and color of star
- Life of the Sun its size at different point in its life.
Stellar Evolution
This is a two week long alternative to the HR diagram. It has not been used by many people and thus has no helpful tips. If you have done this lab and have helpful tips for future TAs, please notify the webmaster.
Mapping the Galaxy
This is an arts-and-crafts style of lab intended to help students visualize how objects look depending on one’s viewpoint. Students consider how different distributions of objects appear depending on whether they are viewed from the center or from the outside. Students then plot locations of four types of objects (nebulae, open clusters, globular clusters, and galaxies) on a map of the sky. They make a globe out of this map and figure out what idealized distributions best describe what objects and from that generalize about our galaxy. On the bright side the lab should explain why we know the shape of our own galaxy even though we’re stuck inside it. On the down side this lab requires good spatial visualization skills that not all of your students may have.
This lab refers to two basic distributions: flattened disk (duh), and “uniform” (objects distributed uniformly inside a sphere).
You might find it useful if you do the first part of the lab, the distributions of the classroom, with the class as a whole. Students have trouble visualizing how the distributions would look from different viewpoints. You can have each group member make a globe per object type, or have them do all of the objects on the same globe. At the end of the lab students are asked to draw our galaxy as it would appear from the outside, showing where the nebulae, open clusters, and globular clusters are located. Please check this drawing to ensure it looks something like this and not this.
There are extra copies of the map in the Master Copy Binder.
Useful websites:
- Mike’s Mapping the Galaxy lecture
- Answer sheets: .pdf
- Pulsar distribution on the sky
- Globular cluster distribution on the sky
- Gamma ray bursts on the sky map of 2,704 from BATSE, redder dots indicate higher energy events
- The Milky Way from gamma to radio
- Better resolution map
Galaxy Morphology
This binder lab familiarizes your students with galaxies by having them look at pictures of spirals, ellipticals, interacting galaxies, and dwarf irregulars. Students will examine shape and color differences and (hopefully) glean an understanding of the various stellar populations in different galaxies.
In your intro lecture you should cover types of galaxies and the Hubble tuning fork diagram. If your students haven’t done HR Diagram lab, or maybe even the Spectroscopy lab, and if they haven’t covered the whole color-temperature-age thing about stars, they will be confused. You might want to take a minute to cover stellar evolution. Regardless, they still might confuse the age of red supergiants and red dwarfs, so please emphasize that or they will think that every kind of red star means a really old stellar population.
This is a long lab, so if students take longer than 2 minutes to classify/discuss a galaxy, they are taking too long. Have them give an explanation for their choices and move to the next one.
After we go through the difficulty of teaching the students about star colors and population ages, we then describe pink/red HII regions. Immediately, the students want to say that HII regions are red and so must indicate an old stellar population. Explain how the young stars pump out a lot of high energy light that make the surrounding gas glow pink. The fact that the gas hasn’t been blown away by their stellar wind, and the fact that there are still such massive blue stars, are both signs that these stars just formed. Use the analogy of rain the Summer: it’s so dry and hot that water should evaporate quickly — if you see raindrops on the sidewalk, that must mean it just rained.
Color blind students suffer until they hit the multiwavelength images, which are thankfully black and white. Students in general sometimes have trouble with the multi-wavelength section because they aren’t used to seeing images with narrow filters. Remind them which colors of light correspond to what kinds of stars.
Useful websites:
How Many Galaxies
This is like a mini-binder lab, since there is only one binder and the students only look at one picture for the lab. This lab has students start by examining the Hubble Deep Field North image (actually, they count galaxies) and finish by calculating the average density of the universe. Hopefully the students will get three things from this lab:
- The power of estimation (and understanding errors in estimation)
- The reason astronomers cannot study “the whole universe” and do small surveys instead
- That there’s a lot of stuff out there but that there’s even more space
Like Orbit of Mercury, it’s best to work through this lab ahead of time. Also, count the chairs in the room before your students get there. The students may not understand the parallel between the chairs example and the galaxies, insisting that a survey can still be done to count every single chair … try to explain it in terms of University budgets, and what it would be like to replace all of the uncomfortable chairs on campus. Instead of using the black and white HDF image in the lab, have the students use the color print outs in the How Many Galaxies binder in the closet (but don’t forget to collect the images after lab, otherwise we have to print more out).
This lab is full of unit conversions, which gives the students a lot of trouble. Check their work often before they wander off on some weird garden path of mathematics. It’s a given that when they have to divide by a number in scientific notation, they’ll type in their calculators 2 / 3 x 10⁸ rather than 2 / (3 x 10⁸). When their numbers get too large or too small, look for a mistake like that.
At the very end of the lab, the students are asked about the density they calculate for the universe and whether this is large or small. It seems students don’t always have a good grasp of what density means, or they confuse it with mass. The students are asked to compare the universe’s density to that of a single atom of hydrogen in a cubic cm (1.67 x 10⁻²⁴ g/cm3). For fun you can compare it to the density of gold (19.32 g/cm3), water (1 g/cm3), Earth’s atmosphere (1.29 x 10⁻³ g/cm3), Mars’ atmosphere (2.0 x 10⁻⁵ g/cm3), etc..
You can also project a high resolution version of the HDF grid image or you could point out the HDF poster on the left side of the front of the room.
Useful websites:
- Answer sheets: .pdf
- Hubble Deep Field
- Hubble Ultra Deep Field
- Zoom-in gif of HDF
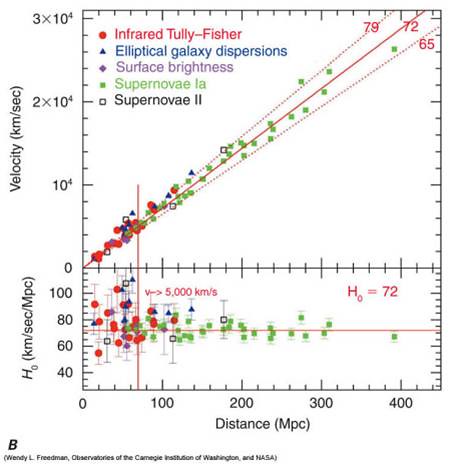
Hubble’s Law
This lab does the impossible task of relating the concepts of the Doppler effect, redshifting of light, and age of the universe. The students measure the redshift of the calcium doublet in galaxy spectra, calculate the recession velocity of those galaxies, determine the Hubble constant, and then play around with the Hubble constant to get a rough age of expansion of the universe. Yeah, they do all of that. In your intro lecture you should go over the Doppler Effect for sound and then transition to how it works for light. As a demo, there is a tuning fork on a string in the closet, hanging from some magnets on the side of the metal shelves.
Try to stress that the Hubble constant is a relation, the slope of the plot of distance and recession velocity. The students then play around with their value for the Hubble constant, wherein there is manipulation of scientific notation numbers by unit conversion, etc.. Just as in How Many Galaxies, they will mess up this math and forget order of operations when manipulating the numbers. When doing unit conversion, the students may make the mistake of cross-multiplying instead (they figure it’s a good trick, so it works everywhere).
Students can have trouble with the measurements and calculations. This lab is no exception. Consider the spectra they are given. The spectrum at the top of the image is the visible part for our Sun, showing some absorption lines. Those lines are schematically represented in the images below that as black lines. Note the nice calcium doublet in the purple. The students are supposed to measure in millimeters the shift between the rest frame doublet and the galaxy cluster doublet by measuring the distance between the leftmost of the doublet lines (393.3 nm). Frustratingly, students in the past have measured from the rest frame leftmost to the galaxy cluster rightmost. It might or might not help for the students to see the spectra in color, but just in cast you want to print some out, here is a color image of the spectra. There are also extra copies of the color image in the Master Copy Binder.
Try to make them understand that redshifting is a perspective effect: a receeding galaxy appears red to us but it’s not actually emitting more red light because of its motion, just as we would appear red to them but aren’t actually emitting more red light. Watch out, for the students may think that all red stars are receeding and all blue stars are approaching, forgetting about intrinsic star color.
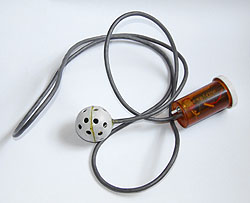
Kurt created a neat little demo gadget: a Doppler Ball (shown to the right). There’s a speaker inside the ball and a 9V battery inside the medicine capsule. When you press the switch at the base of the capsule, the speaker emits a single tone. If you swing it over your head like a lasso, students should hear the tone Doppler shift. The Doppler Ball should be stored in the Bx102 closet.
Also, students have gotten confused about the ‘How do we measure distances to galaxies’ section … you might want to work that out on the board, perhaps at the end of your lab lecture. If you go on to get them to understand how the universe can not have a center, all the better.
Useful websites:
- Mike’s Hubble’s Law Lab lecture
- Answer sheet: .pdf
- Doppler applet demonstrates sound speed and moving objects
- Hubble and his first version of the graph
- Hubble’s Law diagram showing Virgo cluster deviations
- Hubble’s Law diagram using SNe, galaxies, etc.
- Expansion of the universe why clusters aren’t ripped apart
- Expanding bread with raisins
- Expanding universe red-shifting light
WWW Extra Credit
This lab is totally optional and is in the form of a webpage. This page has links to a series of astronomy sites such as APOD and Hubble Space Telescope. Ideally, students visit a site, learn about something, and write about what they learned in the text box provided on the WWW Extra Credit webpage. After they visit all of the pages we list, they fill in their name, their professor’s name, their TA’s name and click the “submit” button. This emails the text to the webmaster, who sends to the appropriate TA
Some TAs use this as a make-up lab, and some don’t use it at all. However, don’t tell your students about the make-up until the very last lab, otherwise you’ll have students skipping a lab knowing they’ll be able to make it up.
If the WWW Extra Credit webpage doesn’t work, or any of the sites are down, let either Jon or the webmaster know. Make sure your students hit the “submit” button so it emails the form rather than trying to print out the page, otherwise the text they wrote might get cut off in the printout.
Review
The last lab of the semester is often a review lab. This serves two purposes: a last chance for the students to turn in/pick up work and to review the astrophysics covered in lab. The usefulness of the first purpose is pretty clear. But since there is no lab exam like many Biology and Chemistry labs have (one more reason to take Astronomy courses), why do you need to review the material? For one, it’s part of being a good TA to ensure your class actually learned something. For another, many professors like to put questions about the labs on the final exams, so it’s useful to cover the material again.
The actual “review” part of the Review lab has no formal structure, so you are open to doing whatever you want. This can range from just asking if anyone has any questions to giving a full-blown lecture. Most take the form of a question and answer period where you try to clear up anything they don’t understand (astro related topics only). The trick is how to provoke them into asking questions. Just asking if they have any questions almost always leaves to no one having questions. They want to get out of the lab as fast as they can and don’t want to look stupid in front of their classmates by asking stupid questions.
The most effective way to get them to ask questions is to pass out notecards at the beginning of class. Have them write down their name and a question. Tell them this is how they get their points for the day, even though most professors do not assign any points to the Review lab. The students don’t need to know that. Give a brief rundown of all the labs you did over the course of the semester to remind them of everything they did. Then gather the cards and run through them. By forcing them to write down a question and by keeping them anonymous as you go through them, the students are much more likely to actually ask about things they don’t understand. You can usually fill the entire lab time with questions this way and actually get interesting discussions.